Table of Contents

Introduction
Have you ever started building a web application and felt lost in the complexity of your own code? You're not alone. Many developers jump straight into coding without proper planning, only to find themselves tangled in a web of confusion later. This is true for beginners and startup founders who often "vibe code" their way through projects, making troubleshooting their applications a frustrating and time-consuming nightmare. In this guide, we'll explore how to use visual diagrams to plan your web applications better. We'll look at various UML diagram software options and introduce you to Eraser.io, a powerful online UML diagram maker that integrates with GitHub.
Why Care About Software Diagrams?
Think of software diagrams as blueprints for your web application. Just as architects don't build houses without detailed plans, developers shouldn't build complex applications without proper diagrams. They help you:
- Understand the overall context of your application.
- Communicate ideas with team members.
- Identify potential issues early.
- Save time and reduce errors.
- Make better design decisions.
Understanding Different Types of Software Diagrams
UML Diagrams
UML (Unified Modeling Language) is a universal language for software design. Here are the most important types you should know:
- Class Diagrams
- Sequence Diagrams
- Use Case Diagrams
UML Class Diagram Explained
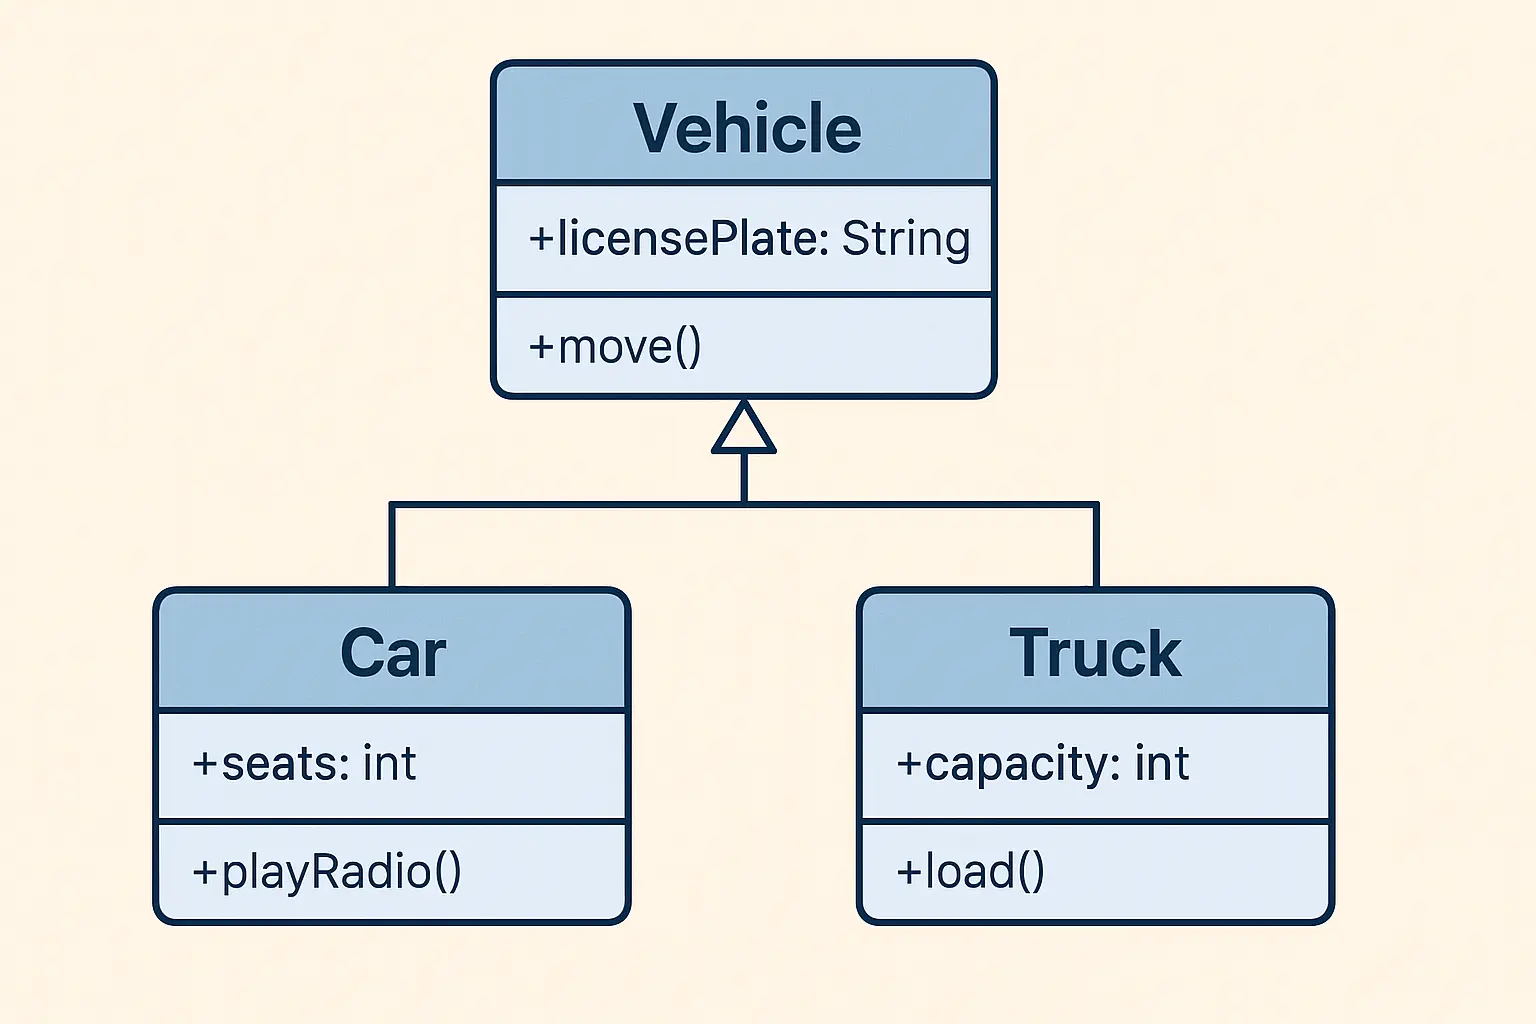
The diagram above shows a simple example of how different types of vehicles can be organized using a UML class diagram. This is a way to plan out how parts of a program should work.
At the top, there's a class called Vehicle. This is the main or "parent" class. It has a piece of information called licensePlate, which is a string (a group of letters and numbers), and a function called move(), which indicates the vehicle can move.
Below that, there are two other classes: Car and Truck. Both of these are types of vehicles, so they inherit from the Vehicle class. That just means they get the same basic features (like licensePlate and move()), but they also have their own special features.
- The
Carclass has a number calledseatsto show how many people can sit in the car and a function calledplayRadio()to play music or news. - The
Truckclass has a number calledcapacity, which indicates how much weight or stuff it can carry, and a function calledload()to load items into the truck.
The lines and arrows in the diagram show that Car and Truck come from the main Vehicle class, meaning they’re connected and share some common traits.
This diagram helps programmers plan and build software in a clear and organized manner.
UML Sequence Diagram Explained
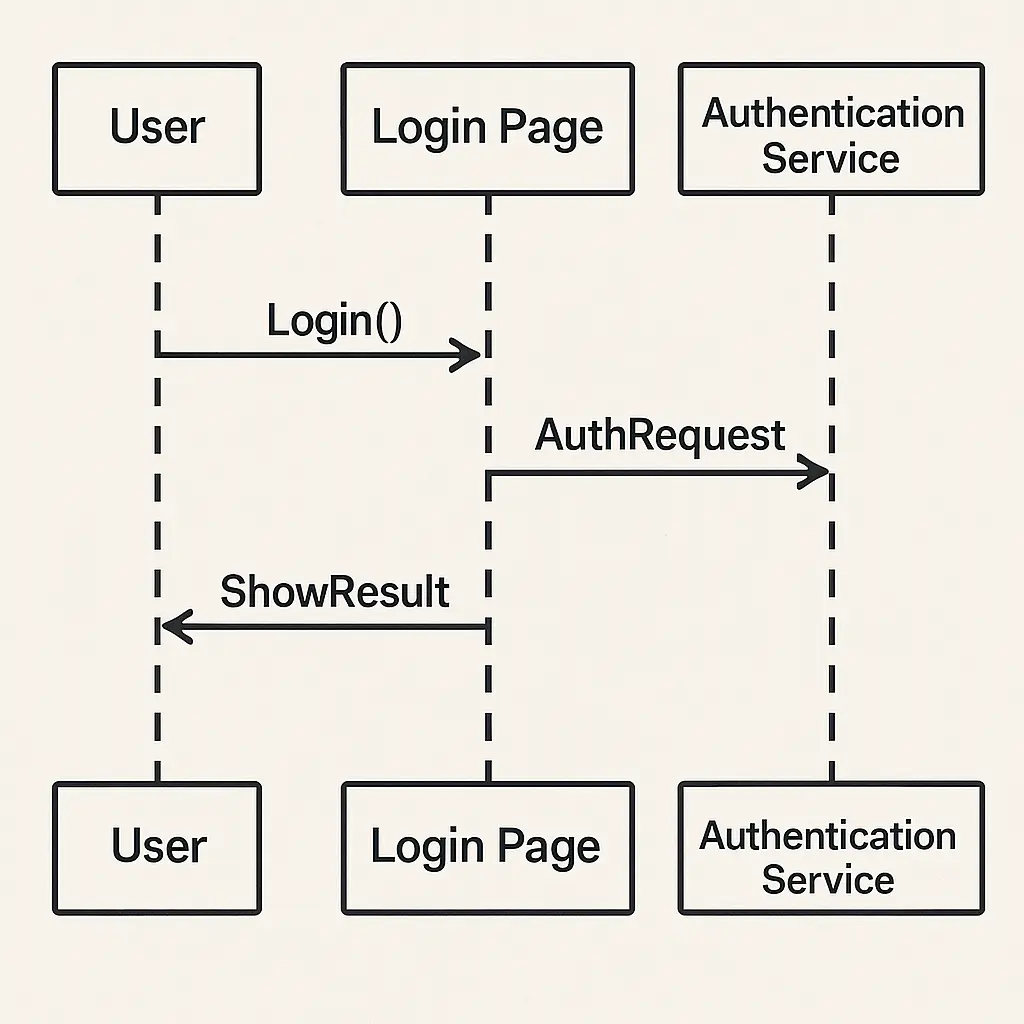
This sequence diagram shows how a user logs into a website. It's a timeline of how different software systems interact with each other in sequence.
Who's Involved? There are three main parts (called "participants"):
- User is the person attempting to log in.
- Login Page – the web page where the user enters their information
- Authentication Service is the system part that verifies if the login info is correct.
Step-by-Step Breakdown
- User enters their username and password on the login page.
- The Login Page sends this information to the Authentication Service to verify if it’s correct.
- The Authentication Service looks it up and determines if the info is right or wrong.
- It then sends back the result (success or failure) to the Login Page.
- The Login Page shows a message to the User – either “Welcome!” or “Incorrect password.”
Sequence diagrams help us see the flow of information in a system. By mapping these interactions visually, you can spot potential problems in your system design and optimize the flow of information between components.
Use Case Diagrams Explained
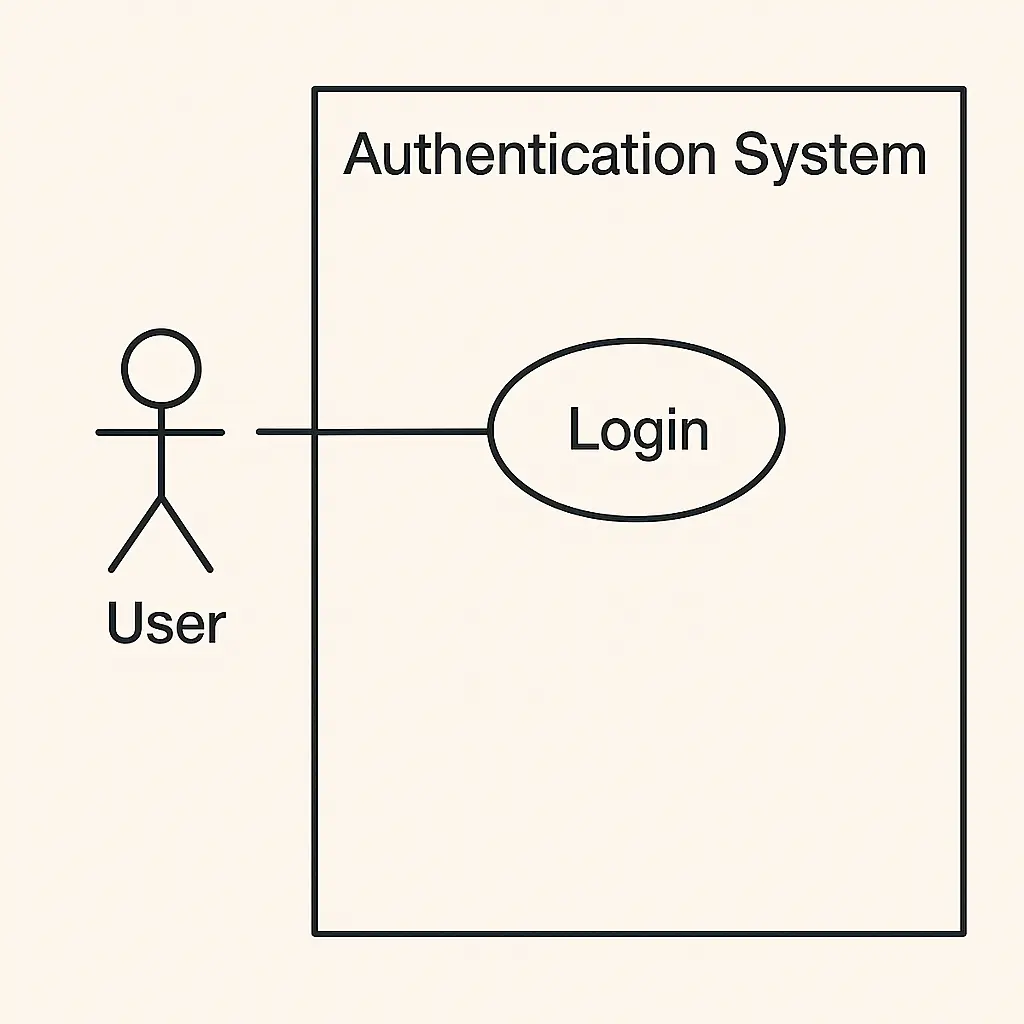
A UML Use Case Diagram visually shows user interactions with a system. It serves as a sketch mapping out who uses your application and what they can do with it.
Who is involved?
A use case diagram has two main parts:
- Actors are the people (or systems) who use your software, such as a user logging into a website.
- Use Cases – These are the actions or tasks that the actor can perform, such as Login, Sign Up, or Reset Password.
The diagram shows:
- Who can do what in your system?
- How users interact with the features.
- The boundaries of your system (what’s included and excluded).
It helps everyone — from developers to business stakeholders — understand what the system should do from a user perspective.
Why Use It?
- It’s great for planning features.
- Helps determine user requirements.
- Encourages clear communication between technical and non-technical teams.
A UML Use Case Diagram is a storyboard for your software. It shows who does what and keeps everyone on the same page. If you’re building an app or designing a system, it’s a great first step to sketch out before coding.
Entity Relationship Diagrams (ERD)
ERDs are crucial for database design, serving as blueprints for your data. If you're new to databases, an ERD helps you visualize how different pieces of information connect, providing a map of relationships.
They demonstrate:
- Database tables (like "Users" or "Products" tables)
- Relationships between tables, such as a user having multiple orders, (how tables connect)
- Data types and constraints (rules for your data - like "usernames must be unique" or "price must be a number")
- How information flows through your system (data paths)
Entity Relationship Diagram Explained
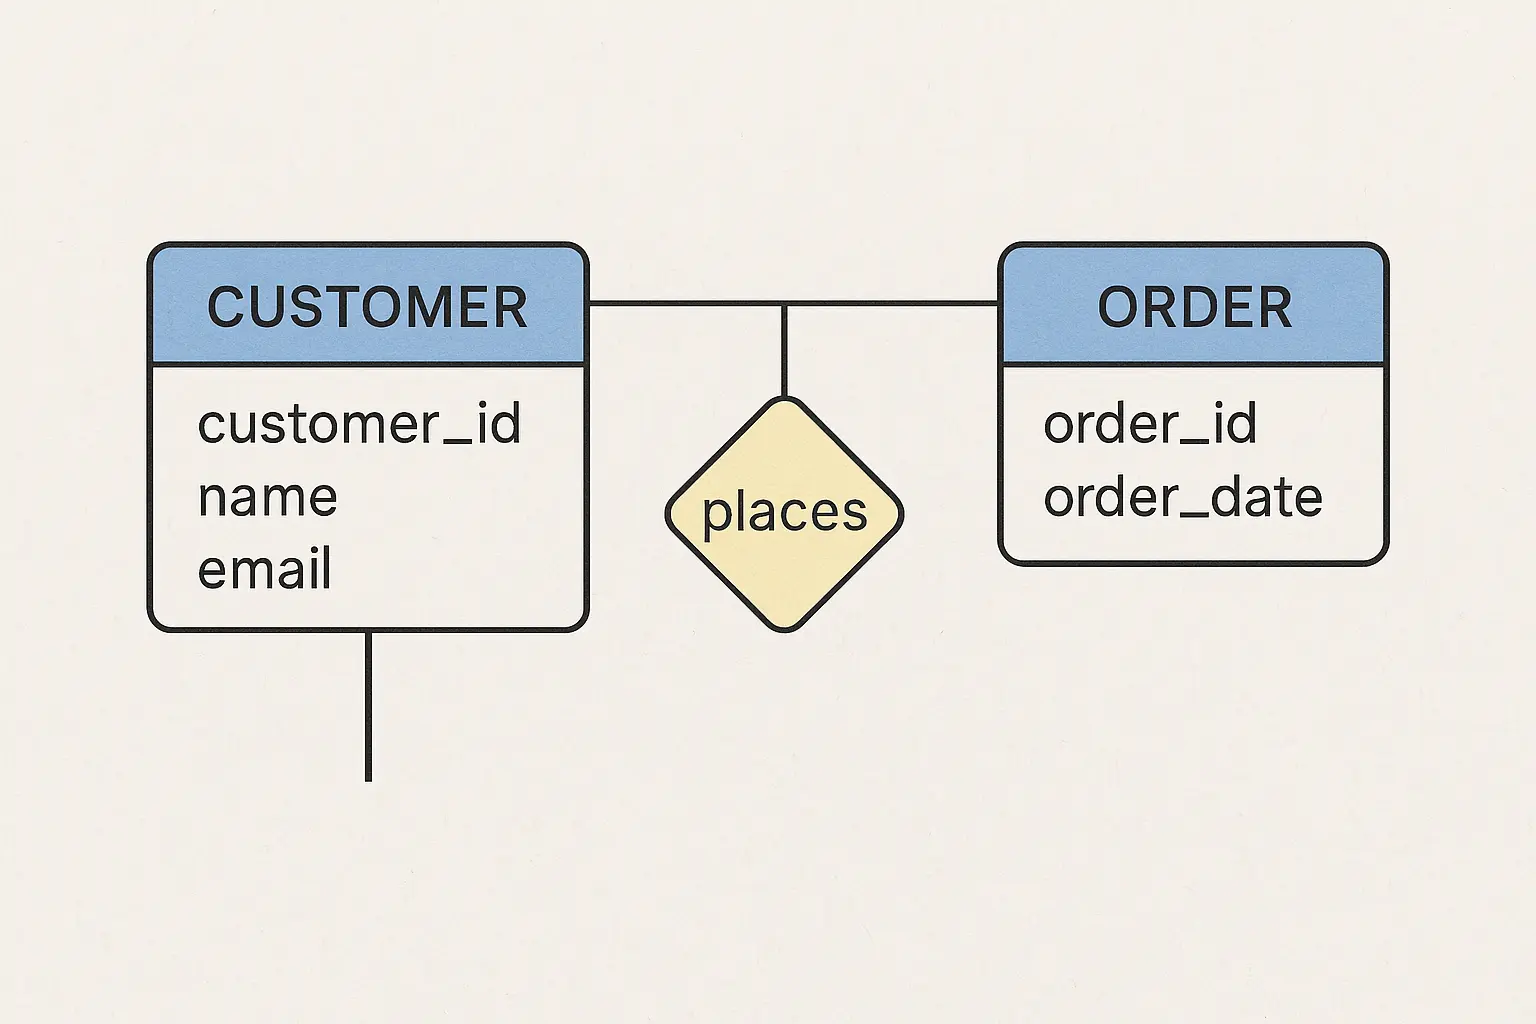
Let’s look at a basic ERD example. Imagine we’re building a simple system to track customers and their orders. Here’s what the diagram shows:
The diagram has two main entities:
- CUSTOMER – This represents individuals who purchase something.
- ORDER – This represents customer purchases.
- A diamond shape with the word “places” inside it, showing the relationship between customers and orders.
- The diagram uses lines to connect the entities to the relationship, making their links clear.
In simple terms, a customer places an order.
The diagram uses connecting lines to show relationships between entities, making it easier for beginners to understand how data is connected in a system. You can see the relationships quickly rather than reading lengthy explanations.
Getting Started with Eraser.io
Many UML diagram apps exist, including several UML diagram tool free alternatives. However, Eraser.io offers a unique combination of features that make it particularly valuable for developers. Among the available diagram tools, Eraser.io combines UML and ERD capabilities with broader technical documentation features. The platform allows developers to create diagrams and maintain comprehensive project documentation in one place.
- Clean, Simple Interface: No complex menus or tools
- Diagram-as-Code: Write simple text to create diagrams
- Real-Time Collaboration: Work with team members instantly (similar to a Miro canvas)
- Version Control: Monitor changes and iterations
- Multiple Diagram Types: Support for all major software diagrams
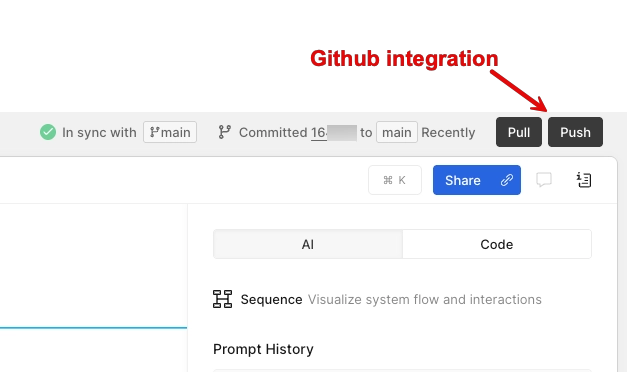
GitHub Integration
Eraser.io offers GitHub integration that improves your development workflow. Here's what you can do:
- Connect to GitHub Repositories: Link Eraser to your GitHub repos to keep your diagrams in sync with your code.
- AI-Powered Diagram Generation: Eraser's AI can analyze your GitHub repository and automatically generate relevant diagrams based on your codebase.
- Version Control for Diagrams: Store your diagrams alongside your code in GitHub for easy change tracking and documentation maintenance.
- Collaborative Workflow: Team members can access and update diagrams through GitHub, ensuring everyone remains aligned.
This integration makes it easier to maintain up-to-date visual documentation of your projects while leveraging AI to understand and visualize your code structure.
Using Eraser.io with Replit
Replit is a comprehensive online development platform that combines an Integrated Development Environment (IDE) with AI capabilities. For just $25 per month, you get access to an AI development assistant that can help you build applications in minutes instead of months. Combined with Eraser.io, you create a workflow that handles both planning and implementation:
- Plan in Eraser.io
- Build in Replit
Replit's AI capabilities allow you to build basic to moderate applications in minutes, while traditional development might cost thousands of dollars and take weeks or months. The AI agent acts as your personal developer, understanding plain English instructions and translating them into functional code.
Read more about my experience with Replit AI Agent.
Best Practices for Creating Diagrams
- Start Simple
- Keep it clear
- Choose the Appropriate Diagram
Practical Example
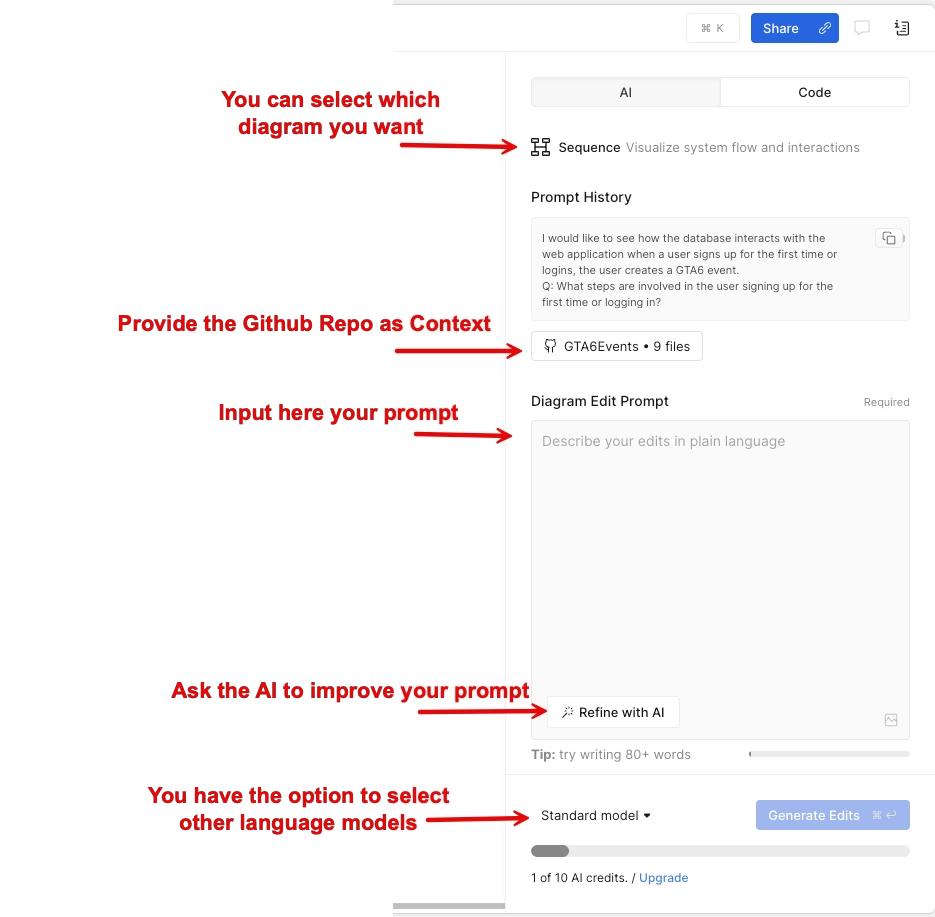
Let's look at a real-world example using GTA6.events, a gaming event web app I built on Replit as an academic exercise. To create a UML diagram with example flows, I'll walk through mapping out the user journey - from signup to event creation and sharing. This is useful for visualizing complex user interactions that would be difficult to explain in text. The process is powered by Eraser's AI integration, allowing you to feed it context from your GitHub repository and use natural language prompts to generate relevant diagrams. This approach helped me visualize the entire flow and create UML diagrams that served as a development guide.
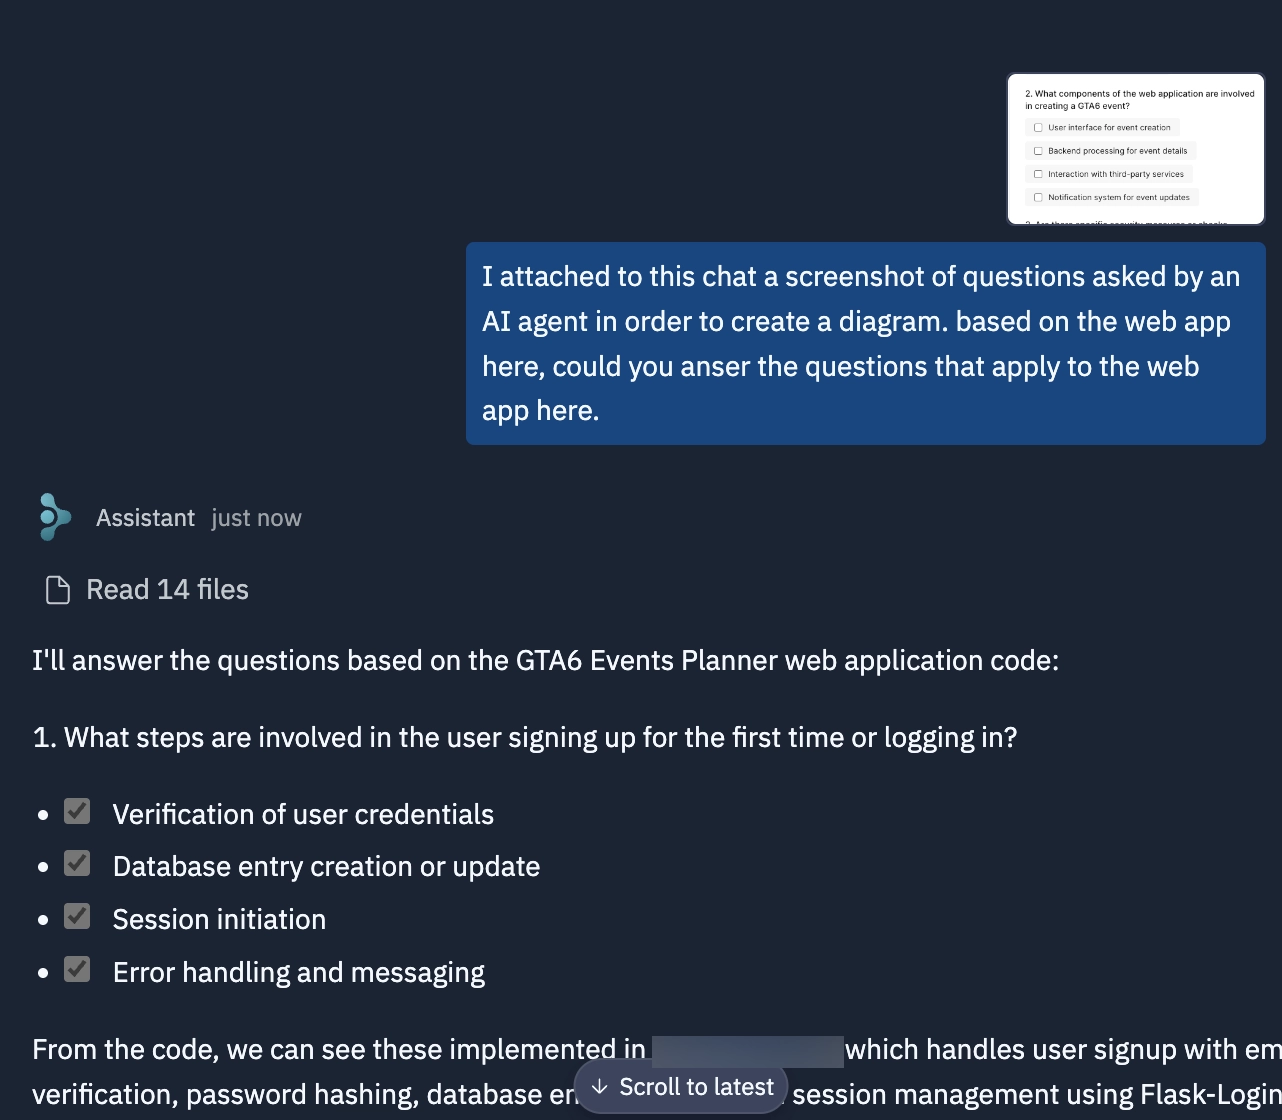
Then, the AI will ask you some follow-up questions. If you're not sure how to answer them, here's a helpful trick: take a screenshot of the AI's questions and upload it to Replit's Assistant. The Assistant will help you understand what's being asked and give you clear answers that you can use in Eraser.
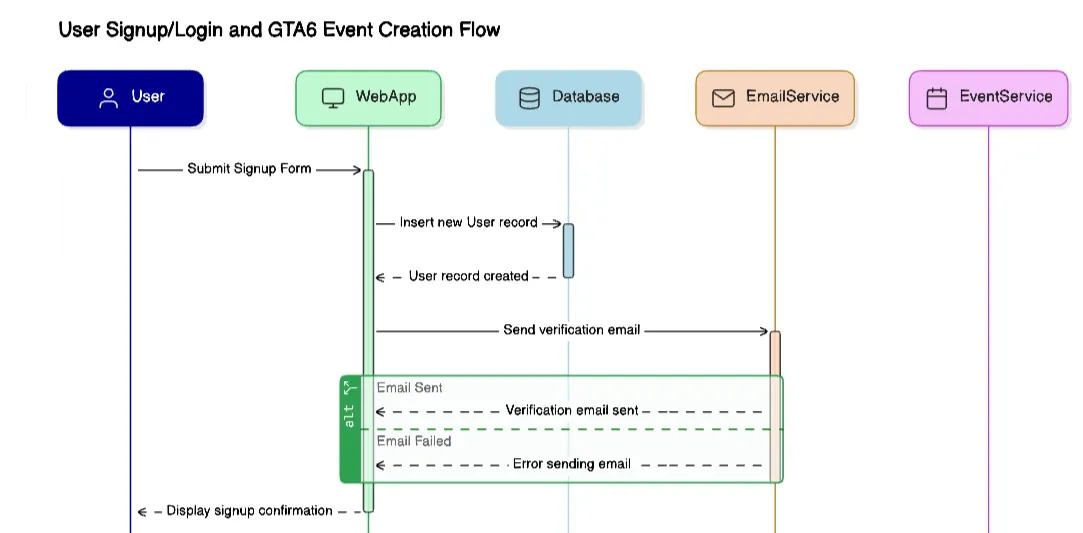
After you confirmed all settings and answered the follow-up questions, you can click on ‘Generate Edit’. After a minute or so you have the diagram ready. Eraser offers a Canvas for editing the diagram, and once satisfied, you can upload it directly to your GitHub Repository.
Now that you've seen how to create your first diagram, you can apply these principles to create other types of diagrams in Eraser. Whether you need Flow Charts for complex processes, Entity Relationship Diagrams for database structure, or UML diagrams for class modeling, the workflow remains similar:
- Start with a specific goal.
- Use Eraser's AI to create an initial diagram.
- Refine the diagram using the Canvas editor.
- Save and share your work via GitHub.
Tip: When working with different diagram types, take advantage of Eraser's templates and AI prompts specific to each diagram style. For example, when creating an ERD, prompt the AI with "Generate an entity relationship diagram for a user authentication system" to get started.
Iterate and refine your diagrams as your understanding of the project evolves. Don't worry about getting it perfect on the first try.
Conclusion
At first, planning your web applications with proper diagrams might feel like extra work, but it pays off enormously as your projects grow. Tools like Eraser.io and Replit make creating and implementing these designs easier. Good planning today saves countless hours of confusion tomorrow.
FAQs
What is a UML diagram? A UML (Unified Modeling Language) diagram is a standardized visual representation of software systems. Like an architect's blueprint, it helps developers plan and understand how different parts of an application will work together before writing any code.
How to draw a UML diagram? Start with a clear goal, choose the appropriate diagram type for your needs, and use tools like Eraser.io that provide templates and AI assistance. Focus on capturing the essential elements first, then add details as needed.
How to create an Entity Relationship Diagram (ERD)? An ERD (Entity Relationship Diagram) maps out how data is organized and connected in your database. Start by identifying your main data objects (entities), their characteristics (attributes), and how they relate to each other.